Spirit Airlines adds two new routes to Colombia
January 9, 2020
Boeing is recommending 737 MAX simulator training
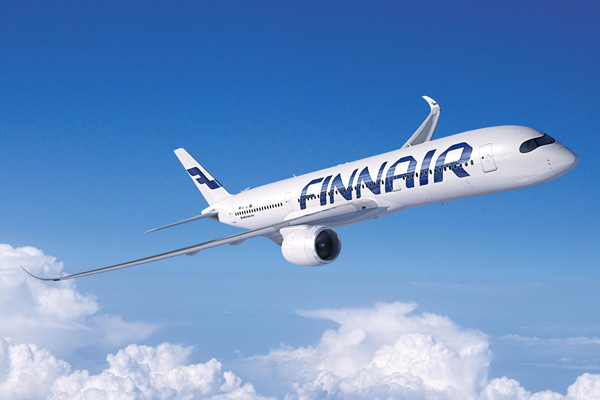
January 9, 2020Finnair made this announcement:

Passenger load factor improved in December year-on-year and annual number of passengers reached new all-time high with 14.7 million and 10.3% growth
In December, Finnair experienced strong demand and carried 1,154,000 passengers, 11.7% more than in the corresponding period of 2018. The overall capacity measured in Available Seat Kilometres (ASK) increased in December by 12.3%. Finnair’s traffic measured in Revenue Passenger Kilometres (RPKs) increased by 13.5%, and the Passenger Load Factor (PLF) increased year-on-year by 0.8% points to 77.2%.
Finnair’s long-haul capacity increased year-on-year with two new A350 aircraft that entered the service after the comparison period. The ASK growth in Asian traffic was 13.1%, mainly due to the doubling of Hong Kong frequencies as well as the openings of new Daxing (Beijing) and Sapporo routes in November and December respectively. The North American capacity increased by 26.6% following the opening of new Los Angeles route in March.
In European traffic, the ASKs were up by 9.6%. The growth derived from additional seating capacity in some of the existing narrow-body aircraft and the changes in route network. The added capacity was directed especially to London. The ASKs in domestic traffic increased by 3.8% mainly due to the added capacity to longer flights.
RPKs increased in Asian traffic by 13.0%, in North American traffic by 28.6%, in European traffic by 12.0% and in domestic traffic by 6.7%. The PLF was 77.7% in Asian traffic, 81.2% in North American traffic, 77.3% in European traffic and 66.4% in domestic traffic.
Passenger numbers increased in Asian traffic by 12.7%, in North American traffic by 25.1%, in European traffic by 13.5% and in domestic traffic by 4.7%.
Available scheduled cargo tonne kilometres increased by 10.9% year-on-year and revenue scheduled cargo tonne kilometres increased by 0.8%. Overall global uncertainty in world trade continues to press global air freight market and was especially visible in Finnair’s cargo markets in Asia. Cargo performance in early December was still shadowed by the Finnish postal and support strikes in late November.
In December, 81.4% of all Finnair flights arrived on schedule (63.4%).
Traffic statistics for January 2020 will be published on Friday 7 February 2020.
| Finnair Traffic Performance December 2019 | ||||
| Month | % Change | YTD | % Change | |
| Total traffic | ||||
| Passengers 1,000 | 1,154.0 | 11.7 | 14,650.4 | 10.3 |
| Available seat kilometres mill | 3,914.7 | 12.3 | 47,188.1 | 11.3 |
| Revenue passenger kilometres mill | 3,023.7 | 13.5 | 38,533.6 | 11.2 |
| Passenger load factor % | 77.2 | 0.8p | 81.7 | -0.1p |
| Cargo tonnes total | 13,811.1 | 2.9 | 173,282.1 | 9.6 |
| Available tonne kilometres mill | 579.2 | 12.7 | 6,921.1 | 11.0 |
| Revenue tonne kilometres mill | 356.1 | 10.2 | 4,541.4 | 10.7 |
| Asia | ||||
| Passengers 1,000 Asia | 202.1 | 12.7 | 2,555.8 | 7.2 |
| Available seat kilometres mill Asia | 1,979.4 | 13.1 | 23,303.6 | 10.7 |
| Revenue passenger kilometres mill Asia | 1,539.0 | 13.0 | 19,329.0 | 7.4 |
| Passenger load factor % Asia | 77.7 | -0.1p | 82.9 | -2.6p |
| Europe | ||||
| Passengers 1,000 Europe | 671.4 | 13.5 | 9,264.0 | 12.9 |
| Available seat kilometres mill Europe | 1,386.4 | 9.6 | 17,893.4 | 9.8 |
| Revenue passenger kilometres mill Europe | 1,071.9 | 12.0 | 14,472.4 | 13.0 |
| Passenger load factor % Europe | 77.3 | 1.6p | 80.9 | 2.3p |
| North Atlantic | ||||
| Passengers 1,000 North Atlantic | 34.2 | 25.1 | 457.0 | 27.4 |
| Available seat kilometres mill North Atlantic | 326.2 | 26.6 | 4,068.4 | 29.7 |
| Revenue passenger kilometres mill North Atlantic | 265.0 | 28.6 | 3,470.4 | 32.1 |
| Passenger load factor % North Atlantic | 81.2 | 1.2p | 85.3 | 1.5p |
| Domestic | ||||
| Passengers 1,000 Domestic | 246.4 | 4.7 | 2,373.6 | 1.9 |
| Available seat kilometres mill Domestic | 222.6 | 3.8 | 1,922.8 | 1.2 |
| Revenue passenger kilometres mill Domestic | 147.8 | 6.7 | 1,261.8 | 2.6 |
| Passenger load factor % Domestic | 66.4 | 1.8p | 65.6 | 0.9p |
| Cargo Traffic | ||||
| Europe tonnes | 3,199.4 | 22.4 | 35,182.0 | 53.7 |
| North Atlantic tonnes | 901.3 | 16.1 | 13,574.4 | 30.1 |
| Asia tonnes | 9,673.7 | -3.1 | 123,953.4 | 6.5 |
| Domestic tonnes | 36.7 | -24.4 | 572.3 | 0.8 |
| Cargo scheduled traffic total tonnes | 13,811.1 | 2.9 | 173,282.1 | 15.3 |
| Cargo flights, tonnes** | 0 | 0 | 0 | 0 |
| Cargo Traffic tonnes total | 13,811.1 | 2.9 | 173,282.1 | 9.6 |
| Available tonne kilometres* mill | 151.7 | 10.9 | 1,871.9 | 13.9 |
| Revenue tonne kilometres mill | 85.6 | 0.8 | 1,092.8 | 9.2 |
| Available sched. cargo tonne kms*, mill | 151.7 | 10.9 | 1,871.9 | 15.0 |
| Revenue sched. cargo tonne kms, mill | 85.6 | 0.8 | 1,092.8 | 10.6 |
| Cargo load factor* % | 56.4 | -5.6p | 58.4 | -2.5p |
| – North-Atlantic cargo load factor* % | 54.9 | -2.3p | 56.2 | 4.1p |
| – Asia cargo load factor* % | 60.6 | -8.5p | 63.3 | -5.1p |
| Scheduled traffic Cargo load factor*, % | 56.4 | -5.6p | 58.4 | -2.3p |
* Operational calculatory capacity
** Including purchased traffic
- Change %: Change compared to the figures of the respective periods in the previous year (p = points).
- Available seat kilometres. ASK: Total number of seats available. multiplied by the number of kilometres flown.
- Revenue passenger kilometres. RPK: Number of revenue passengers carried. multiplied by kilometres flown.
- Passenger load factor: Share of revenue passenger kilometres of available seat kilometres.
- Available tonne kilometres. ATK: Number of tons of capacity for carriage of passengers. cargo and mail. multiplied by kilometres flown.
- Revenue tonne kilometres. RTK: Total revenue load consisting of passengers. cargo and mail. multiplied by kilometres flown.
- Overall load factor: Share of revenue tonne kilometres of available ton kilometres.


