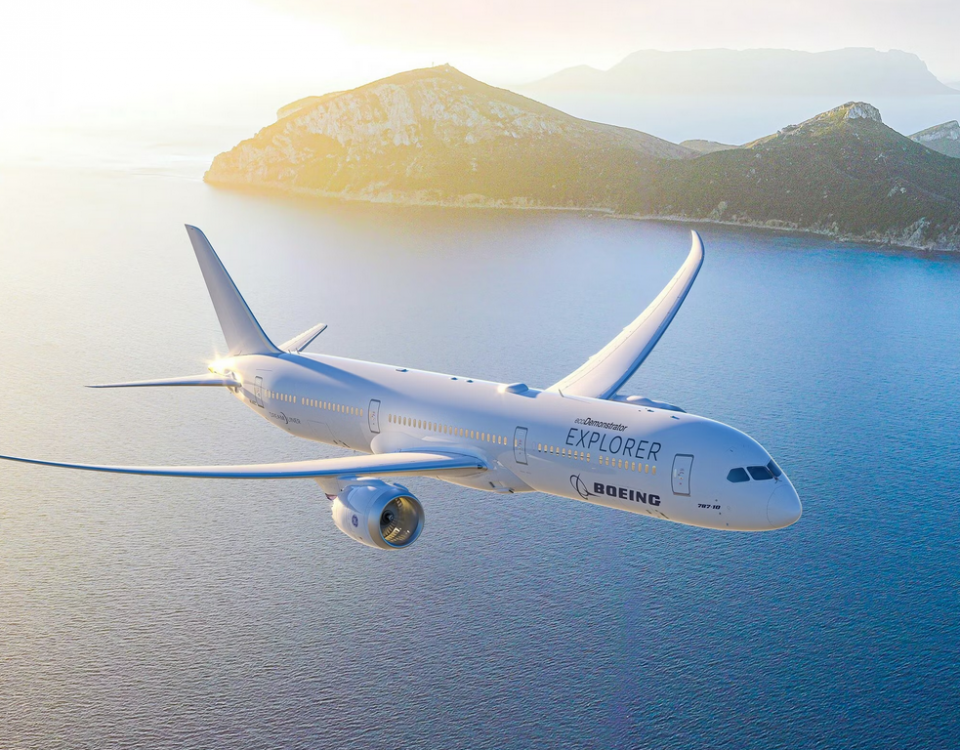
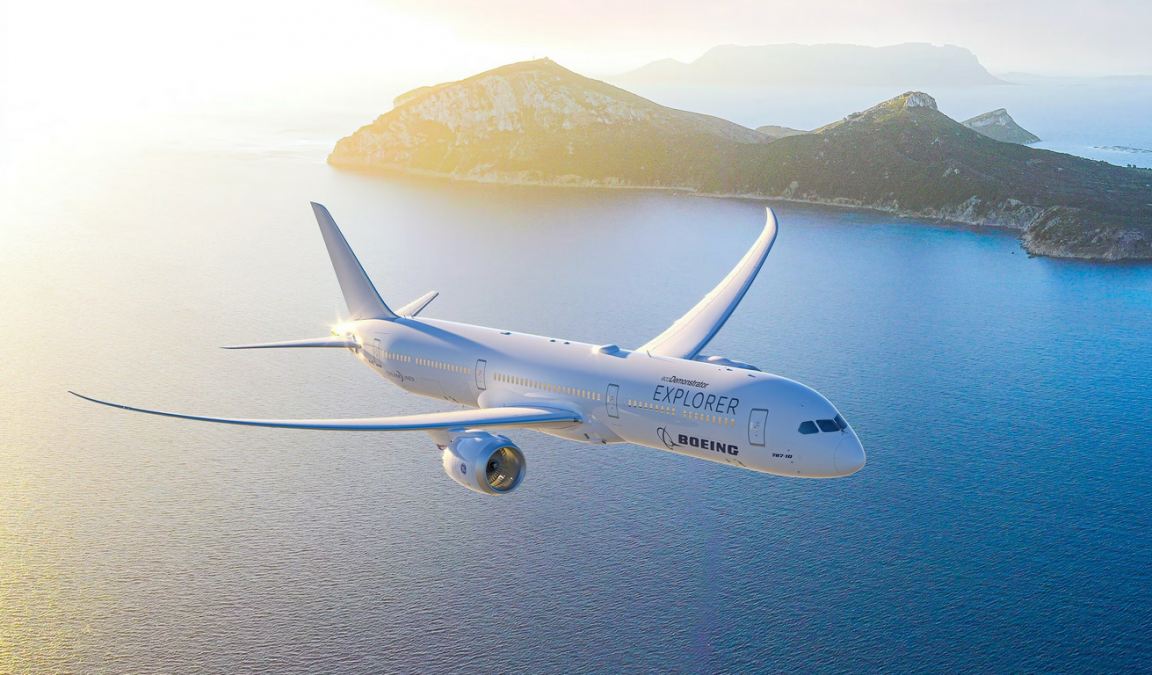
Boeing unveils new Transonic Truss-Braced Wing
January 10, 2019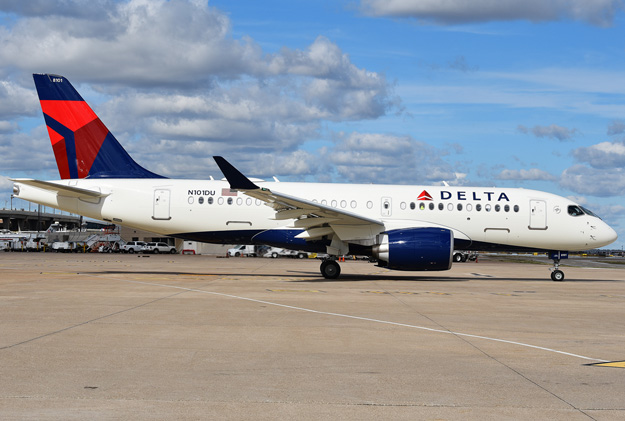
Delta expands Airbus A220 order book to 90 total aircraft, orders larger version
January 10, 2019
Geneva – The International Air Transport Association (IATA) announced healthy but moderating global passenger traffic results for November 2018. Total revenue passenger kilometers (RPKs) rose 6.2% compared to November 2017, a slight deceleration from 6.3% growth in October. Capacity (available seat kilometers or ASKs) increased by 6.8% over the year-ago period, and load factor dipped 0.4 percentage point to 80.0%. It was only the third time in two years that load factor fell on a year-to-year basis.
“Traffic is solid. But there are clear signs that growth is moderating in line with the slowing global economy. We still expect 6% demand growth this year. But trade tensions, protective tariffs and Brexit are all uncertainties that overhang the industry,” said Alexandre de Juniac, IATA’s Director General and CEO.
| november 2018 (% year-on-year) | World share1 | RPK | ASK | PLF (%-pt)2 | PLF (level)3 |
|---|---|---|---|---|---|
| Total Market | 100.0% | 6.2% | 6.8% | -0.4% | 80.0% |
| Africa | 2.2% | 2.2% | 1.2% | 0.7% | 69.8% |
| Asia Pacific | 33.8% | 6.3% | 7.4% | -0.8% | 80.2% |
| Europe | 26.7% | 8.8% | 8.8% | 0.0% | 81.7% |
| Latin America | 5.1% | 6.2% | 6.0% | 0.1% | 82.0% |
| Middle East | 9.4% | 2.6% | 5.2% | -1.8% | 69.4% |
| North America | 22.8% | 5.1% | 5.0% | 0.0% | 83.6% |
International Passenger Markets
November international passenger demand rose 6.6% compared to the year earlier period, up from 6.2% in October. All regions showed growth, led by carriers in Europe. Total capacity climbed 6.7%, and load factor dipped 0.1 percentage point to 78.4%.
- European carriers saw demand increase by 9.0% in November 2018, which was a nine-month high. Given the mixed signs on the economic backdrop in the region it is unclear whether this pace of growth can be sustained. Capacity climbed 9.1% and load factor slipped 0.1 percentage point to 82.1%, the highest load factor among the regions.
- Asia-Pacific airlines’ November traffic climbed 6.0% compared to the year-ago period, up from 5.7% growth in October. Capacity also rose 6.0% and load factor was flat at 79.1%. Growth is underpinned by rising living standards and continuing expansion of options for travelers.
- Middle East carriers had a 2.8% demand increase, which was the lowest among the regions for a third consecutive month. Capacity rose 5.6% and load factor slipped 1.9 percentage points to 69.0%.
- North American airlines’ traffic climbed 6.1%, in November, up from 5.7% in October and well ahead of the five-year average rate of 4.0%. Capacity rose 3.8% and load factor edged up 1.7 percentage points to 80.6%. Demand is supported by comparatively strong momentum in the US economy.
- Latin American airlines’ November traffic climbed 5.8% compared to November 2017, which was an increase from 5.2% growth recorded in October. Despite the increase, growth has slowed on a seasonally-adjusted basis. Capacity rose 6.6% and load factor slipped 0.6 percentage point to 80.6%.
- African
airlines experienced a 5.7% rise in demand compared to November 2017,
down from 6.4% in October but higher than the five-year average of 5.8%.
Growth is occurring despite challenges in the continent’s largest
economies, Nigeria and South Africa. Capacity rose 3.9% and load factor
climbed 1.2 percentage points to 68.9%.
Domestic Passenger Markets
Domestic travel demand rose 5.6% in November 2018 compared to the same month in 2017, its slowest pace in 11 months and down from 6.5% in October. All markets except Australia showed growth. Domestic capacity climbed 6.9%, and load factor dropped 1.0 percentage point to 82.8%.
| November 2018 (% year-on-year) | World share1 | RPK | ASK | PLF (%-pt)2 | PLF (level)3 |
|---|---|---|---|---|---|
| Domestic | 35.9% | 5.6% | 6.9% | -1.0% | 82.8% |
| Dom. Australia | 0.9% | -0.7% | -1.1% | 0.3% | 82.6% |
| Domestic Brazil | 1.2% | 5.3% | 4.1% | 1.0% | 83.6% |
| Dom. China P.R. | 9.1% | 7.2% | 10.2% | -2.3% | 82.0% |
| Domestic India | 1.4% | 13.3% | 19.8% | -4.8% | 84.4% |
| Domestic Japan | 1.1% | 1.5% | 3.0% | -1.1% | 75.6% |
| Dom. Russian Fed. | 1.4% | 13.8% | 10.9% | 2.1% | 81.6% |
| Domestic US | 14.3% | 4.9% | 5.9% | -0.8% | 85.2% |
- India’s domestic traffic rose 13.3% in November compared to November 2017, marking the 51st consecutive month of double-digit domestic growth. However, it was also the slowest increase in 16 months.
- Brazil’s domestic traffic rose to a four-month high of 5.3% in November, against a fragile economic backdrop.